Abstract
Next generation sequencing (NGS) investigations have identified individual mutations that have been useful in differential diagnoses and as biomarkers of prognosis. These tasks are complicated by the heterogeneity of mutations, the overlap of their spectra between disease subtypes, their combinations, and their clonal architecture. All of this drives diversity and obscures individual genotype/phenotype associations. Our goal was to develop robust new approaches to assessing such phenotype/genotype associations.
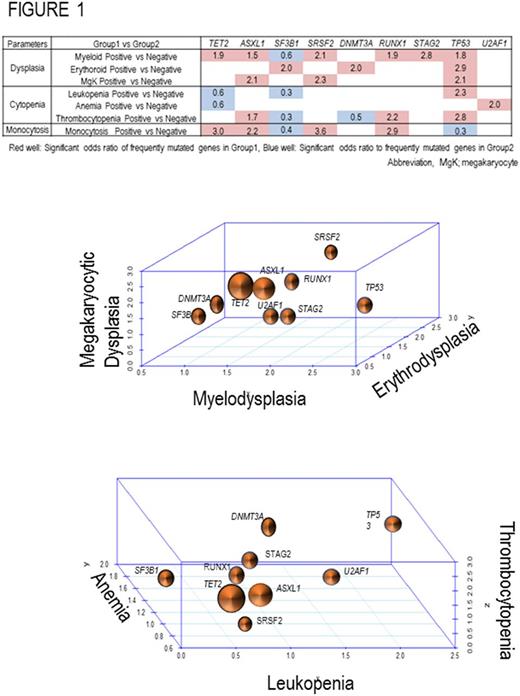
Our focus is on the relationship between cell morphology and counts and mutations and their combinations. We hypothesized that while MDS morphology is heterogeneous, it must be result molecular lesions occurring in particular hierarchical relationships. Based on this we examined 681 cases of MDS that were comprehensively annotated in terms of the presence of diagnostic morphologic abnormalities; these were assessed by an unbiased pathologist who uniformly used standard diagnostic criteria. Abnormalities included the presence of fibrosis, individual lineage dysplasia, cytopenia, and increases in monocyte and megakaryocyte counts. Correlations between these disease features and mutational profiles, considering clonal dominant and secondary events separately, were then assessed. The bio-analytic platform used generated 3-dimensional plots of odds ratios of changes in morphologies, cell counts, and stage, which were estimated using logistic regression cubes, in which the odds of association with particular morphological changes have been plotted for each mutation. Similar 3D regression cubes have been generated for cytopenias or stage of the disease. This analysis included initial hits and animation to visualize the impact of subsequent hits on lineage dysplasia, myeloproliferation, and % blasts.
Along the continuum between myelodysplasia/myeloproliferation and acute leukemia, 32% (219/681) of patients had trilineage dysplasia. Myeloid, erythroid and megakaryocyte dysplasia occurred in 52% (356/681), 67% (453/681) and, 66% (449/681) of patients, respectively. Monocytosis (>1000/uL) was present in 20% of the patients and 16% of cases displayed a combination of at least 2 lineage dysplasia and myeloproliferative features. Using targeted NGS on a panel of genes often mutated in MDS, ancestral and secondary hits were identified and their impact on phenotype was assessed. For example, ASXL1, SF3B1, and SRSF2 resultinuni-lineage dysplasia (n=155) compared to unilineage MDS cases without dysplasia, and ASXL1, SRSF2, and TP53 mutations are significantly affected in multi-lineage dysplasia (n=219), each having a different, defined association with myeloproliferative features.
Simultaneous analysis of these influences resulted in a number of salient relationships that illustrate how specific phenotypic features evolve in a deterministic molecular context: TET2 mutations confer myelodysplastic and monocytic character; SRSF2 mutations confer myeloid and myeloproliferative character that includes megakaryocytic hyper/dysplasia; mutations in ASXL1, RUNX1, and TP53 impart myelodysplasia; SF3B1 and DNMT3A mutations effected erythroid morphology (Figure 1); SRSF2 and ASXL1 mutations affect myeloid and megakaryocyte lineage; and TP53 mutated cases showed significantly higher frequency in multi-lineage dysplasia. Focusing on cytopenia, TP53 mutations significantly correlated with leukopenia and thrombocytopenia, U2AF1 mutations associate with anemia, RUNX1 and ASXL1 mutations associate with thrombocytopenia, and mutations in TET2, ASXL1, SRSF2 and RUNX1 associate with increased odds of myeloproliferation, particularly monocytosis . We then applied this approach to ancestral events. In 3D, we were able to visualize how common secondary hits shape the phenotype landscape of progression and concomitant cytopenia.
Our report results of a comprehensive genotype phenotype association study that linked somatic molecular events to clinical features. We demonstrated that with tools and sufficient statistical power, complexities of how molecular context governs morphologic changes can be deciphered.
Sekeres: Celgene: Membership on an entity's Board of Directors or advisory committees.
Author notes
Asterisk with author names denotes non-ASH members.


This feature is available to Subscribers Only
Sign In or Create an Account Close Modal